
Asset Management KPIs for CFOs
Fixed Asset Management KPIs: How CFOs Measure Control, Accuracy, and Efficiency
What Are Asset Management KPIs?
Fixed asset management KPIs measure the accuracy, completeness, visibility, and control of an organization’s physical asset records.
More importantly, they help finance and operations teams answer a practical question: Is our asset management process producing reliable control, or is it only producing a count?
A useful KPI should connect a defined population of assets to a clear decision. It should also show the measurement period, data source, owner, and action threshold. Without those elements, a dashboard may look precise while hiding incomplete coverage or unresolved exceptions.
Why Asset Management KPIs Matter Beyond Counting Assets
An inventory project can record thousands of items and still leave management with unanswered questions. Were all areas covered? Can the team locate each asset? Do the records match the financial data? Are transfers documented? How quickly are exceptions resolved?
Therefore, an effective performance model should measure more than inventory volume. In practice, it should assess:
- Record accuracy.
- Physical-to-record matching.
- Location and custodian visibility.
- Data completeness.
- Exception resolution.
- Tagging coverage.
- Site and zone coverage.
- Handover quality.
Together, these measures turn field inventory data into management information. In addition, they help leaders compare progress across periods without relying on anecdotal updates.
What Makes a Useful Asset Management KPI?
Before selecting a metric, define five points:
- Purpose: What decision will the KPI support?
- Population: Which assets, sites, or departments are included?
- Formula: How is the result calculated?
- Owner: Which team reviews the result?
- Action: What happens when the result falls below the agreed threshold?
For example, “asset accuracy” is too broad by itself. A stronger definition could be: “The percentage of verified records with a matching tag, location, and asset description within the approved scope.”
The formula should remain stable. However, if the scope changes, record the change instead of silently comparing unlike periods.
Five Core Asset Management KPIs for Finance and Operations
1.Asset Record Accuracy Rate
This KPI measures the percentage of reviewed records that match the verified physical evidence across agreed fields.
Example formula:
Accurate verified records ÷ total verified records × 100
First, the organization should define which fields matter. A match may require the correct tag, location, description, and status. Meanwhile, a minor spelling difference may not carry the same risk as a wrong location or duplicate identity.
2. Physical-to-Record Match Rate
This KPI measures how many expected records have a corresponding physical asset within the verified scope.
Example formula:
Matched physical assets ÷ records expected for verification × 100
The result should show whether the team found the asset and confirmed its identity. For that reason, do not treat an item as matched merely because a similar description exists.
3. Unregistered Asset Rate
This KPI identifies assets found in the field without a corresponding record in the approved register or source extract.
Example formula:
Field-only assets ÷ total physical assets found × 100
A high rate may indicate incomplete additions, project handover gaps, or inconsistent local purchasing processes. It may also reveal assets recorded under another identity. Consequently, the KPI should lead to an investigation, not an automatic accounting conclusion.
4. Location Accuracy Rate
This KPI measures how often the recorded location matches the verified location.
Example formula:
Assets with correct locations ÷ assets with verified locations × 100
Location accuracy supports accountability and future verification. In particular, it is useful in hotels, campuses, hospitals, warehouses, and multi-site operations where assets move frequently.
5. Inventory Completion Rate
This KPI measures how much of the approved physical scope the team completed.
Example formula:
Completed zones or assets ÷ approved zones or assets × 100
Always define completion. For example, a zone may be visited but not fully verified. In addition, an inaccessible room or incomplete source list can affect the result. Therefore, record exclusions and limitations alongside the percentage.
Three Advanced Asset Management KPIs for Ongoing Control
Variance Resolution Time
This KPI measures the average time required to close a documented exception.
It can be calculated from the date an exception is created to the date an authorized reviewer closes it. Separate high-priority and low-priority exceptions when the difference matters.
A slower resolution time may indicate unclear ownership, missing evidence, weak transfer procedures, or limited finance capacity. As a result, the measure can reveal process issues beyond the field count itself.
Asset Tagging Coverage
This KPI measures the proportion of in-scope assets with an approved and readable identification tag.
It is useful during initial tagging, new-site handover, and periodic replacement programs. The organization should distinguish between “tag exists” and “tag is correctly linked to the asset record.”
Data Handover Completion Rate
This KPI measures whether the required asset-data package has been completed and accepted by the responsible team.
The package may include the register, images, tags, locations, condition fields, exception report, and agreed export file. A high completion rate should mean more than a file delivery. It should reflect the agreed review and acceptance status.
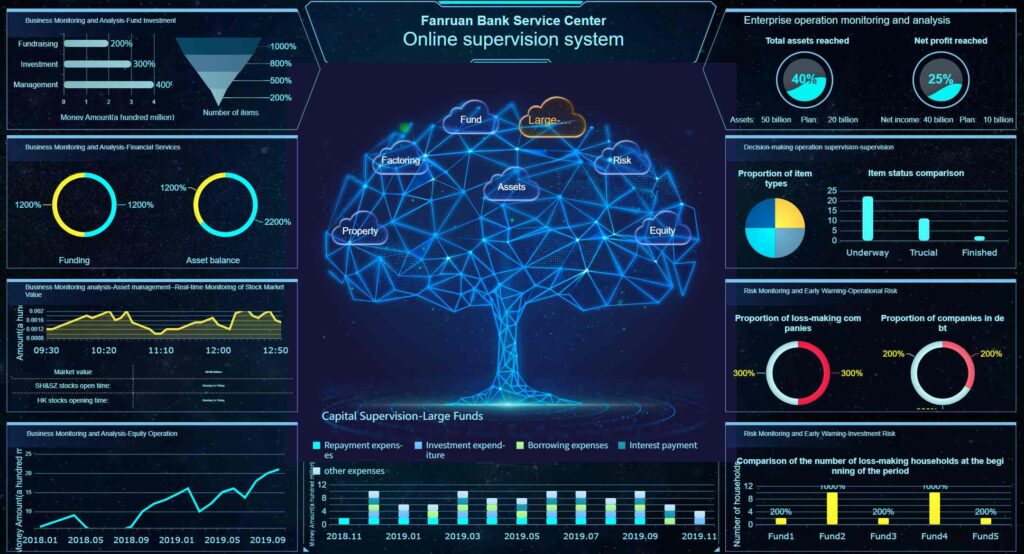
How to Build an Asset Management KPI Dashboard
A dashboard should support decisions, not overwhelm users with numbers. In practice, a practical design can include four views:
| Dashboard view | Useful measures |
| Coverage | Sites, zones, departments, and assets completed |
| Data quality | Accuracy, completeness, match rate, and duplicates |
| Control | Location accuracy, tagging coverage, and open exceptions |
| Action | Resolution time, owners, due dates, and overdue items |
First, use a clear reporting date. Next, show the scope and link summary measures to detailed records. Finally, include notes for inaccessible areas, late source files, or material changes in methodology.
How to Avoid Misleading Asset Management KPI Results
KPI quality can decline when teams optimize the number rather than the control. Avoid these mistakes:
- Reporting 100% completion while excluding difficult areas.
- Combining current field results with outdated financial extracts without a cut-off note.
- Counting possible matches as confirmed matches.
- Comparing sites with different asset scopes.
- Ignoring unresolved high-value exceptions.
- Changing the formula between reporting periods.
- Treating a tag count as proof of accurate data.
A transparent KPI with a lower result is more useful than a high result built on incomplete evidence. Ultimately, decision-makers need a trustworthy signal rather than an attractive percentage.
How Asset Management KPIs Guide Management Decisions
KPIs should lead to action. For example, the following links are useful:
- Low location accuracy may require a transfer-control review.
- A high unregistered asset rate may point to weak project handover.
- Slow variance resolution may require clear exception ownership.
- Low tagging coverage may justify a focused retagging program.
- Repeated errors at one site may indicate a training or process issue.
The dashboard should therefore show the responsible team and next action, not only the percentage. This connection turns measurement into accountability.
How DOIT Supports Asset Management KPI Reporting
DOIT supports organizations by collecting, verifying, classifying, tagging, and structuring field asset data. The work can include zone mapping, photography, condition recording, reconciliation, exception reporting, and asset-register delivery.
This verified information can support management reporting and feed the client’s existing ERP or accounting system according to agreed requirements. DOIT does not replace the client’s ERP or determine the client’s accounting treatment. The client’s authorized teams retain those decisions.
Conclusion
Fixed asset management KPIs help leaders measure whether asset records support control and decision-making. The strongest KPI framework connects physical evidence to a defined scope, consistent formula, responsible owner, and clear action.
When finance and operations review the same reliable data, the organization can move beyond counting assets. As a result, it can identify risk, improve accountability, and focus resources where control is weakest.
Want to measure the quality of your asset data? Discuss an Asset Data and KPI Reporting Scope with DOIT.
Category
Recent Posts

Multi-Site Fixed Asset Management in Egypt & GCC